 The study of adipose tissue is motivated by the negative consequences of obesity. Countless studies have reported that obesity is associated with an increased risk of heart disease, diabetes and other gastrointestinal diseases, and certain cancers.
A search of the term “fat” in the Analyze Publications Database returns over 150 fat-related research articles in which Analyze software has been used to generate data. The vast majority of these studies are related to adipose tissue. Although often used synonymously, the terms “adipose tissue” and “fat” are not the same. Adipose tissue is comprised mostly of fat molecules in adipocytes (fat storage cells), but also contains protein, minerals and water. Fat molecules, predominantly triglycerides, are present in other tissues outside of adipose tissue.
The two imaging modalities capable of quantifying adipose tissue from different compartments are MRI and CT. Each has its advantages and disadvantages. MRI can be acquired at a higher resolution than CT, allowing for the identification of smaller pockets of adipose tissue that would not be visible otherwise. The lack of radiation exposure from MRI allows for full body scans and thus more accurate quantification of adipose tissue. MRI signal intensity can vary with heterogeneities in the magnetic field, and slower scanning can produce artifacts from peristaltic movement in the gastrointestinal tract.
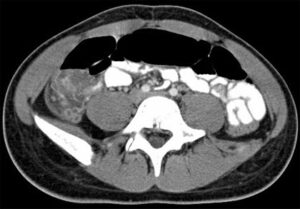
CT has a shorter acquisition time and thus produces clearer images without artifacts from peristaltic movement as in MRI. The attenuation values (in Hounsfield units) generated by CT are consistent between images, facilitating the accurate and straightforward identification of adipose tissue. However, CT carries the risk of increased radiation exposure. This can be managed by acquiring only a few sections instead of a whole body scan.
In the abdominal region, subcutaneous adipose tissue can be separated into superficial (SSAT) and deep (DSAT) compartments divided by Scarpa’s fascia, which is visible in MRI and CT images. There have been shown to be metabolic differences between superficial and deep subcutaneous adipose tissue. In particular, SSAT exhibits higher levels of expression of metabolic regulatory genes, while DSAT exhibits higher levels of expression of inflammatory genes. It has also been found that a higher volume of DSAT is correlated with insulin resistance and that adipocytes in DSAT exhibit more lipolytic activity than those in SSAT, so that a higher volume of DSAT correlates to a higher concentration of free fatty acids.
Visceral adipose tissue (VAT) also contains different types of adipose tissue that vary in their metabolic properties. VAT can be classified by which main body cavity it occurs in: intrathoracic adipose tissue (ITAT) in the thoracic cavity, intraabdominal adipose tissue (IAAT) in the abdominal cavity and intrapelvic adipose tissue (IPAT) in the pelvic cavity.
Analyze software can be used to quickly and accurately segment and quantify the various types of adipose tissue. For a full description of how to do this, please download our guide to adipose tissue classification and quantification.
Tags: Adipose Tissue, Fat, Subcutaneous adipose tissue, Visceral adipose tissue