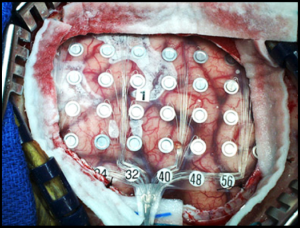
 Intracranial EEG (iEEG), also known as electrocorticography or ECoG, is an invasive procedure used to place grid or strip electrodes on the surface of the brain to record electrical activity. From a clinical perspective, this procedure is extremely useful in evaluating patients with intractable epilepsy, that is, epilepsy that is unresponsive to anticonvulsants. These patients are often implanted with such electrodes to localize the area of the brain where the seizures originates from prior to surgical therapy. However, iEEG also provides researchers studying brain function the chance to study brain processes with unmatched temporal and spatial resolution.
iEEG offers researchers advantages over other neuroimaging methods such as MEG or scalp EEG, as it possesses both high spatial (mm scale) and temporal (ms scale) resolution. A further advantage of iEEG is that intracranial recordings are not as susceptible to contamination from noise sources such as muscle activity and eye blinking, which impair the quality of MEG and scalp EEG recordings
Why Create a 3D Visualization?
In order for researchers to properly interpret the data and understand the relationship between signal, electrode position and underlying brain anatomy, it is essential for the three-dimensional location of the electrodes to be known with respect to the cortical surface. Effective 3D representation of multimodal information, electrodes from a post-implant (post-operative) computed tomography (CT) scan displayed with the underlying brain anatomy from a pre-operative magnetic resonance imaging (MRI) scan, provides researchers with this critically important display.
The 4 Steps to Successful 3D Visualization of Subdural Electrodes and Underlying Brain Anatomy
There are four steps commonly followed to create such visualizations, and they involve manipulation of two imaging datasets: a pre-operative MRI scan, and a post-implant CT scan. The MRI scan provides structural information of the brain, while the CT scan provides positional information of the electrodes.
The four steps to successfully achieving this goal are:
1. Registration of pre-operative MRI to the post-operative CT
Registration is the process of aligning two related data sets into a single image space. In subdural electrode visualization the pre-operative MRI is typically aligned and transformed into the space of the post-operative CT. Registration of the pre-operative MRI to the post-operative CT is the critical first step that facilitates the visualization of the electrodes and brain anatomy in a single image. Once registration is complete key information can now be extracted from each scan for 3D visualized.
2. Segmentation of electrodes from the CT
To create the 3D visualization of the grid electrodes from a post-operative CT scan displayed with the underlying brain anatomy from a pre-operative MRI scan, the structures of interest must be extracted from each scan. The first segmentation task, extraction of the electrodes from the CT scan, requires isolating the voxels that represent the electrodes from the remaining voxels in the CT scan. Separating dense metal electrode implants from surrounding tissue can be achieved rapidly via threshold based segmentation. Setting a global threshold range that includes the grayscale values of the target electrodes voxels and excludes everything else effectively isolates these voxels into an object of interest. Some manual clean-up maybe required to remove structures from the electrodes, such as leads, that are not essential or required for the visualization.
3. Segmentation of the brain from MRI
The next segmentation task and step towards creating the combined visualization is the segregation of the brain. The brain parenchyma can be rapidly isolated from the MRI scan via a number of different automated segmentation approaches. Such approaches are well published in the literature and include watershed or skull stripping routines, region growing, morphological based segmentation, etc. The brain can also be manual delineated on each individual 2D slice, however this approach is more time consuming.
4. Combined 3D visualization of subdural electrodes with underlying brain anatomy
The final step in the process is to create the combined 3D representation of the multimodal data. This involves merging the objects isolated from each scan into a single frame of reference. The resulting image display allows researchers a tool for in-depth review and exploration of topographical relationships between the cerebral cortex and subdural electrodes.
Tags: Visualization of Subdural Electrode Grids